Introduction
Frank Spear, one of the world’s most prestigious restorative dentists, have conducted a very enlightening and practical learning experiences like no other. Spear dental education aims to teach clinical and technical workshops for dentists, technicians and staffs. The online dental education website is founded to train dentists and promote dental health care services to a wider community. It also provides a full range of specialty services including prosthodontic, oral and maxillofacial, oral pathology, radiology and other surgeries. Therefore, it is highly necessary and essential for researchers to analyze about the visitor patterns and behaviors.
Research Objective
The objective of this research is to investigate visitors’ patterns and behaviors when accessing Spear Dental’s major websites and home pages. Three research questions (RQ) are created to guide the direction of this analysis,
Ø RQ 1: To investigate the number of feature uses pattern among the different roles.
Ø RQ 2: To investigate the number of visits distribution on each function group of Spear Dental.
Ø RQ 3: To identity the time spent on Spear Dental’s App among the different roles.
Methodology
Regression is a technique that is often used for predicting some variables by knowing others. It often tells how dependent variables may be correlated with independent variables(Seber&Lee, 2012). Correlation describes the strength of a linear relationship between two variables. In this short research, tableau software will be used to visualize correlations and patterns observed from the secondary data. The secondary data are retrieved from the official website of Spear Dental Education.
Data Collection and Display
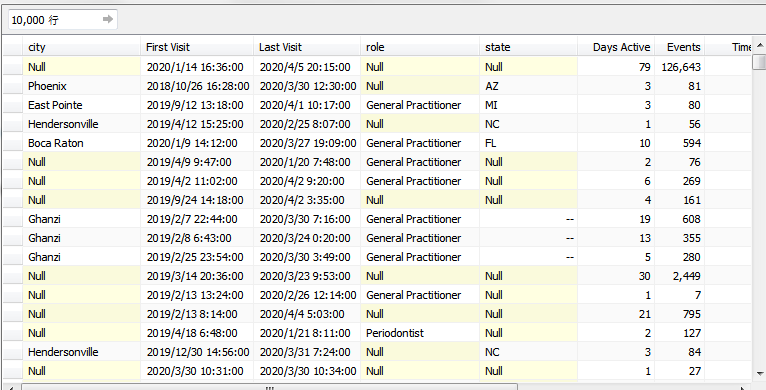
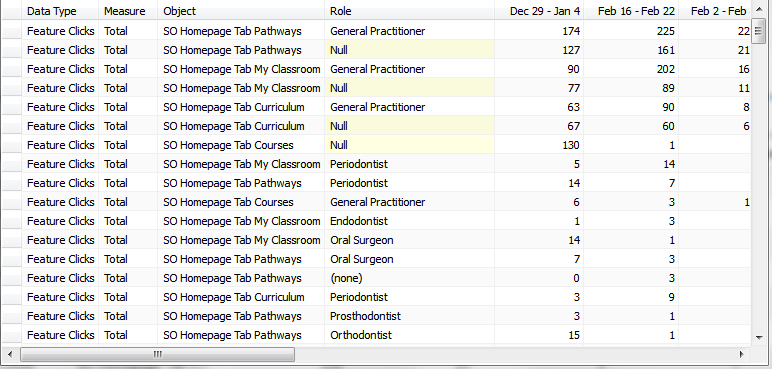
First, in the “feature Use by role” (See appendix 1), the data regarding number of visits among different roles from Dec 29 to Mar 14, 2020, could be illustrated as shown in appendix 1. The total number of feature use such as My classrooms, Homepage Tab pathways, curriculum, courses, etc, are categorized into 14 groups within the period of time (See appendix 2). From the first group (Dec 29 ~ Jan 4), the number of feature uses against the roles are illustrated in the graph below.
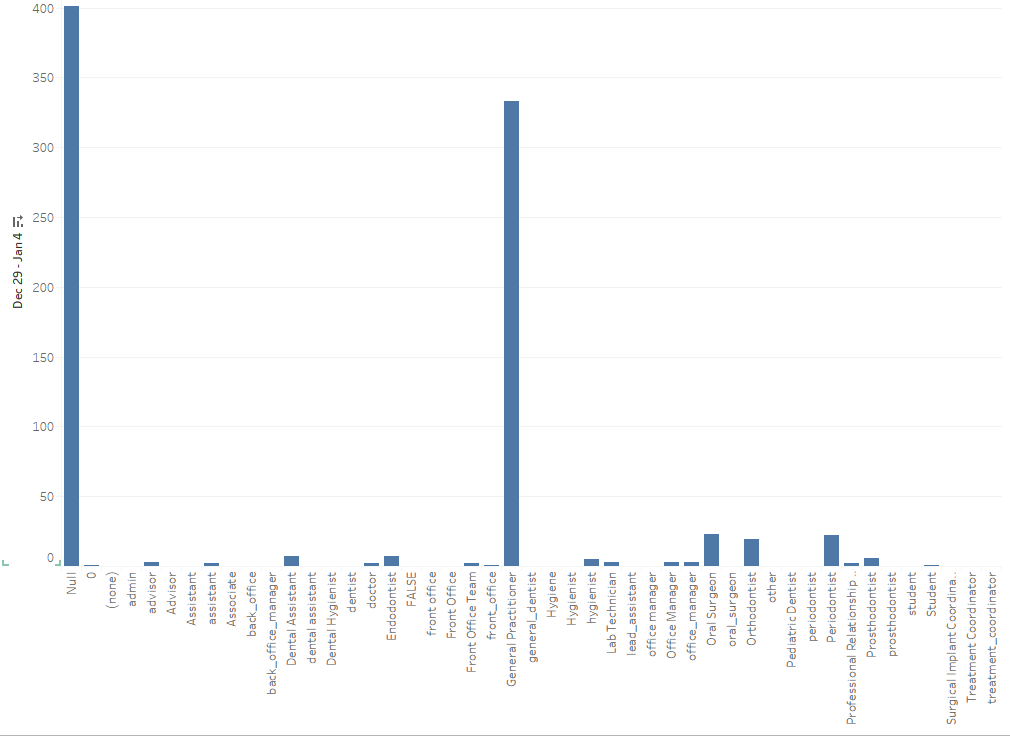
Fig 1: Number of Feature uses from Dec 29 to Jan 4 against the roles.
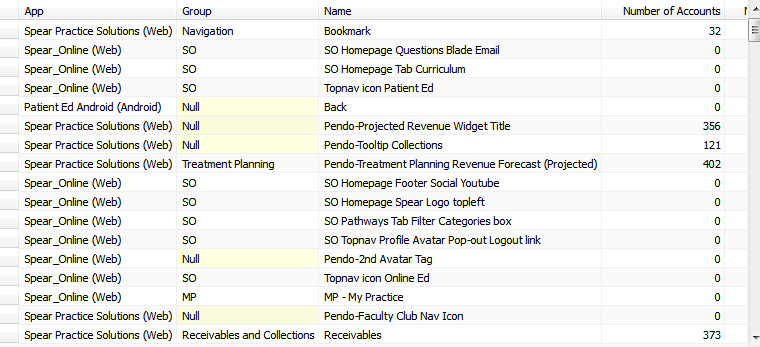
Second, the feature list aggregation is about measuring the total number of visits against the function groups including Action Center, My Day, Spear Online, etc, as shown in figure 2 below. The raw data can be referred to appendix 3.
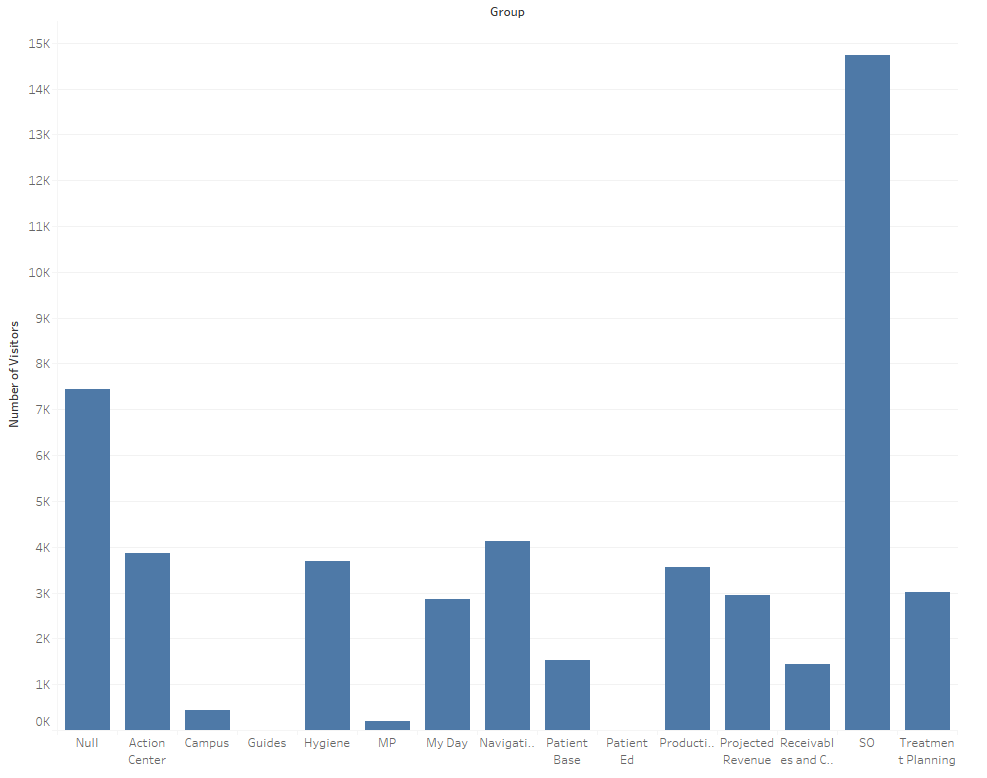
Fig 2: Number of Visits against Spear dental’s major function groups.
Third, the details of visitors are illustrated in the graph below.
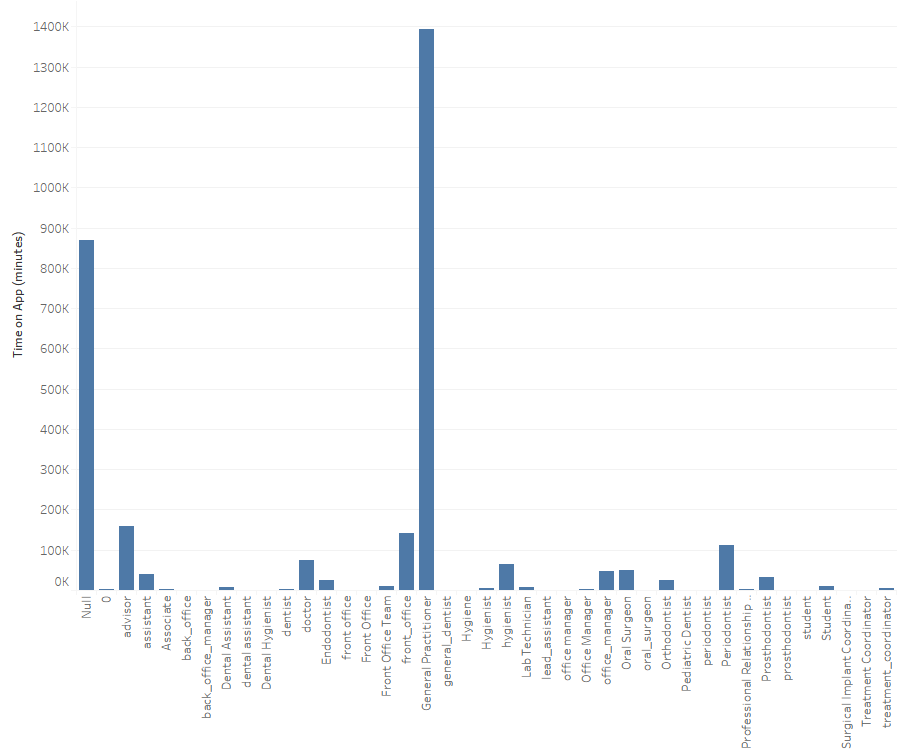
Fig 3: Time Spent on Spear Dental App against roles
Discussion
In figure 1, among all the roles, it can be observed that general practitioners have the most feature uses. General practitioner is referring to a doctor who specializes in dentistry and treats patients in a local community rather than in the public hospital. In other words, Spear Dental’s courses and pathways can provide sufficiently professional support, advice, insights, and guidance for the full-time dentists in the dental clinics. If the instructions and knowledge of the Spear Dental could not meet the clients’ demand, general practitioners will certainly not choose to access the feature uses on the home page.
Moreover, from the second graph, SO (Spear Online) receives the highest visits as compared with other functions in the homepage. Spear Online provides necessary contents for dental education, courses, curricula and educational materials. It is designed for studying purposes. It has the highest clicks because Spear Dental’s major purpose is to teach and develop young talents for providing dental treatment in the future. It means that this objective has been achieved very effectively.
Last, apart from the website services, Spear Dental recently also developed an App-based service for the convenience of target clients. The time spent on Spear Dental App among different roles can be shown in figure 3. The data reflects that general practitioners are the largest group in accessing information from Spear Dental App. The full-time professional dentists can also be deemed as the most loyal customer group among all the roles. It is because general practitioners prefer to have both the highest feature uses and number of visits.
However, from the data collected above, one major concern is that Spear Dental does not effectively target at students. Dr. Spear actually wants to train and develop more young talents for the dental care industry. But from figure 1 and 3, it can be observed that almost no students have accessed the features and Spear Dental apps. In other words, the online dental educational platform fails to create awareness among the student segment. Even though the quality of Spear Dental’s education is very high and widely accepted among the professional general practitioners, students do not show an interests in the programs. As such, marketers of Spear Dental should try to implement effective promotional marketing strategies such as social media advertising to raise brand awareness.
Conclusion
In general, it can be concluded that general practitioners are the largest group among all roles who prefer to access Spear Dental’s features and functions. They also prefer to access the above-mentioned information through the Spear Dental app. Among all the functions available on the platform, SO (Spear Online) receives the highest clicks and visits. In other words, clients believe that the educational programs, materials, courses and curricula are attractive and helpful to them. However, it should also be noticed that the platforms fail to reach young students. Thus, it goes against the intention of Dr Spear, the founder of the platform because it fails to attract the attention from young students. Without sufficient awareness in the target group, it is difficult for the platform to develop young talents into qualified dentists with the Spear Dental education. In the future, marketers of Spear Dental should try to create awareness students in order to attain this goal.
Reference
Seber, G. A., & Lee, A. J. (2012). Linear regression analysis(Vol. 329). John Wiley & Sons.
Appendix:
1. Features by Role in Tableau
2. 14 Groups from Dec 29 to Mar 14

3. Feature List Aggregation
4. Visitor Report
