By:
Date:
1.0 Introduction…………………………………………………………………….2
2.0 China’s International Trade…………………………………………………...2
2.1 Trade between China and the U.S…………………………………………3
2.2 Trade between China and Hongkong……………………………………..6
2.3 Trade Between China and Japan………………………………………….7
3.0 FTA and Gravity model in explaining China’s international Trade………..8
3.1 China’s Current FTA Status ……………………………………………..8
3.2 Tariff and Gravity Model…………………………………………………9
4.0 Conclusion……………………………………………………………………..11
1.0 Introduction
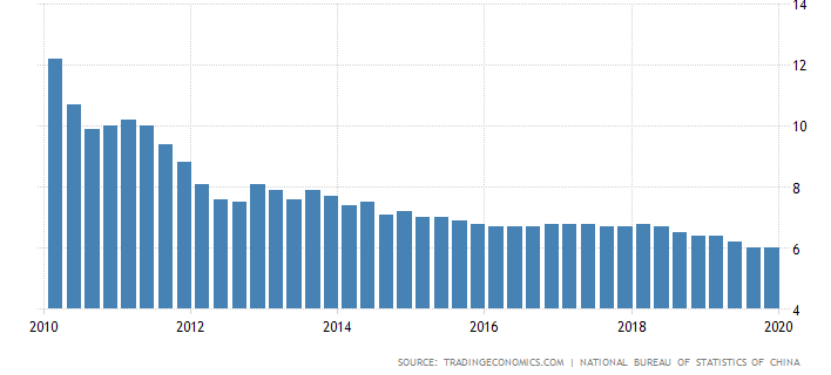
China has one of the oldest civilization. Its population is exceeding 1.4 billion, which represents a 20% of the world’s population. In the decade, China’s economy is developing extremely fast at annually 6.5%. Last year, the Chinese economy is reported to be 6.0 percent on a year-on-year basis. It does match the market prediction as the U.S and China have declared trade war on each other since 2018. The increased tariff on China’s exported goods to the U.S devastatingly affects China’s annual economic growth.As shown in the fig 1, China’s annual economic growth rate is dropped from 6.5 in 2018 to 6.0% this year.
Source Credit: Tradingeconomics.com
Fig 1: GDP Annual Growth Rate of China
International trade plays a very critical role in boosting China’s economic growth. On one hand, China has a very huge population. Majority of manufacturing goods in the world are now processing or assembling in China. It is large because both local and foreign manufacturers notice that China has cheap and skilled labor in producing goods. Besides, China itself is also a very large market for foreign goods as well. It is also the major reason why China is now a very large trading partner for many other countries. China’s top trading three partners in terms of export sales includes the United states with US$479.7 billion, Hongkong ($303 billion) and Japan( $147.2 billion). In this analysis report, an overview of China’s recent international trade with the above-mentioned trade partners will be analyzed in details. Besides, gravity model will also be applied in explaining how the trade conflicts between China and the U.S may affect China’s economic growth.
2.0 China’s International Trade
National Bureau of Statistics of China. China GDP Annual Growth Rate. Tradingeconomics. 2010. [Online]: https://tradingeconomics.com/china/gdp-growth-annual
Workman, Daniel. China’s Top Trading Partners. World’s Top Exports. 2020. [Online]: http://www.worldstopexports.com/chinas-top-import-partners/
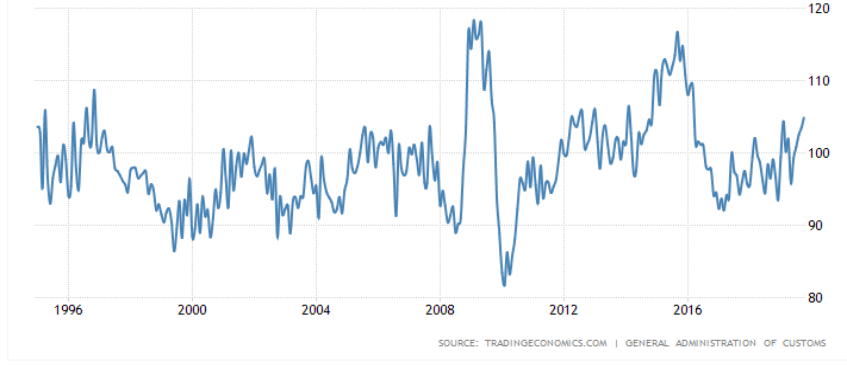
Terms of Trade is often used to measure whether a country is in an advantaged or disadvantaged status in trade relationship. By definition, Terms of Trade or ToT is referring to the ratio between a country’s average export prices and import prices. According to the most updated statistics released by General Administration of Customs of China, in the past decade, average ToT of China is 98.42% from 1994 until 2019. This number is very close to 100%. It implies that the capital of leaving and entering China is more or less balanced. As shown in figure 2, the ToT of China in the past 25 years can be depicted as follows. It can be observed that the ToT drops suddenly from 2008 to 2009. It may be attributed to the global financial crisis. It implies that the price per unit export goods cannot cover the price per unit import goods. Capital is leaving china at a much faster rate. Even though China’s ToT is recovering gradually after 2009. It goes down again due to the current trade war between China and the U.S.
Source Credit: General Administration of Customs of China
Fig 2: China’s Terms of Trade in the past 25 years
Like the aforementioned, China’s top three trading partners are U.S, Hongkong and Japan. In the following sections, trade between each trade partner will be analyzed in details.
2.1 Trade between China and the U.S
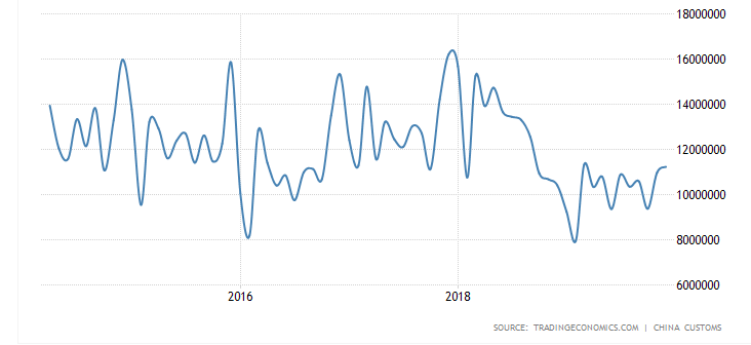
In the last five years, it can be shown that the imports from the U.S is gradually declining. In fact, when the U.S is imposing 25% tariff on China’s export goods, the central Chinese government is also taking the same retaliatory action. In other words, the price of China’s import goods from the U.S is becoming more and more expensive. Local dealers and regional distributors will find it expensive to import goods from the U.S. As a result, the net import from the U.S drops accordingly.
General Administration of Customs of China. China Terms of Trade. Tradingeconomics. 2020. [Online]: https://tradingeconomics.com/china/terms-of-trade
Ko, Jong-hwan, and Jong Wook Ha. "A Trade War between China and the United States and Its Likely Economic Impacts." Journal of Global and Area Studies (JGA) 2.2 (2018): 47-64.
Source Credit: China Customs
Fig 3: China imports from the U.S
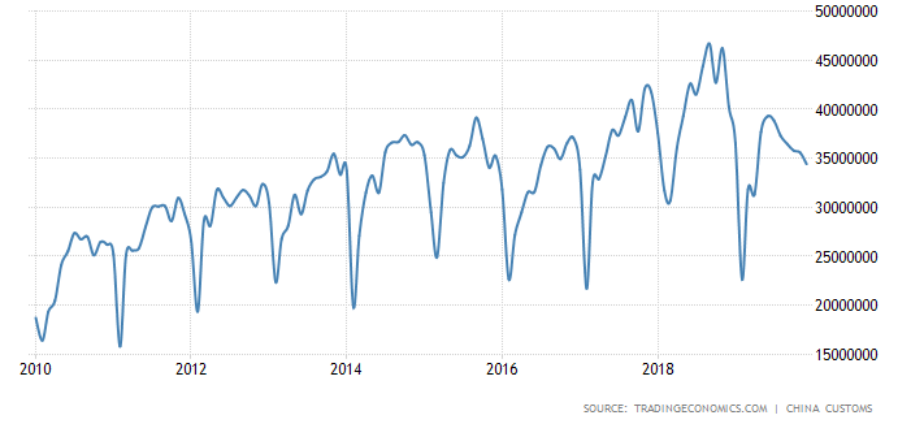
In addition, according to the statistics published by China Customs, the exports from China to the U.S is still in a fluctuatingly increasing despite the fact that the U.S is imposing very heavily tariffs on China’s exports. As a matter of fact, majority of the manufacturing goods which are currently consumed in the U.S are produced or assembled in China. For instance, it is estimated that 90% of iPhone in the world are assembled in China. Even though the U.S is increasing the tariff, Apple company still has to stay in China because it will be time-consuming and costly to shift the manufacturing center, factories and supply chain to another country.
Source Credit: China Customs
Fig 4: China exports to the United States
China’s Balance of Trade with the U.S can be depicted in fig 5 below. China’s current
China Customs. China Imports from United States. Tradingeconomics. 2020. [Online]: https://tradingeconomics.com/china/imports-from-united-states
China Customs. China exports to the United States. Tradingeconomics. 2020. [Online]: https://tradingeconomics.com/china/exports/united-states
trade surplus is reduced to only $47 billion in December 2019. As the aforementioned, Trump’s harsh protectionism measures and tariff policies are effectively in reducing the U.S trade deficit. Previously, the trade deficit is above $50 billion on average.
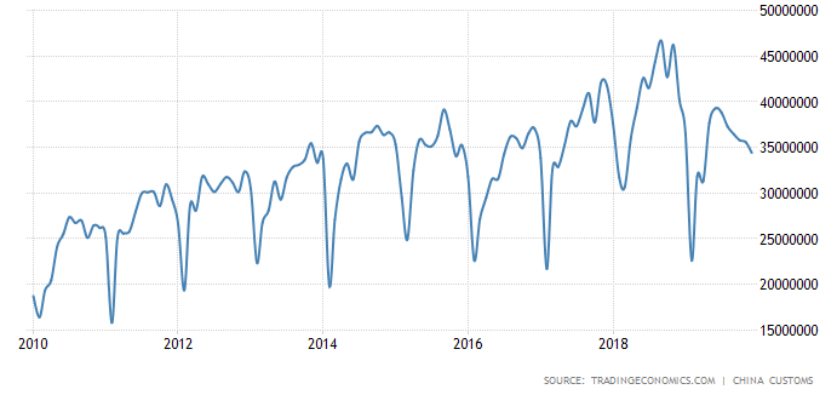
Source Credit: China Customs
Fig 5: China’s Balance of Trade with the U.S
Generally speaking, China is enjoying trade surplus with the U.S. But in terms of terms of trade, it seems that China may be disadvantaged as the ratio is below 100%.
2.2 Trade between China and Hongkong
China’s imports from Hong Kong keep decreasing in the past five years as shown in Fig 6.
China Customs. China’s Balance of Trade. Tradingeconomics. 2020. [Online]: https://tradingeconomics.com/china/balance-of-trade
China Customs. China’s imports from Hong kong. Tradingeconomics. 2020 [Online]: https://tradingeconomics.com/china/imports-from-hong-kong
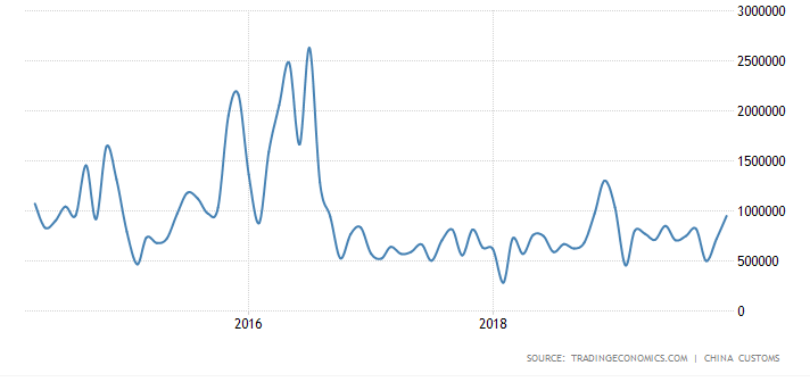
Source Credit: China Customs
Fig 6: China’s imports from Hong kong
The among of imports is decreasing largely because Hong Kong is now suffering from a high degree of political instability. The rise of anti-China sentiment leads to a very serious consequence that mainland China’s importers are not confident in doing business with Hong Kong people. The 2019-20 Hongkong protests devastatingly affects the trade relationship between the city and mainland China.
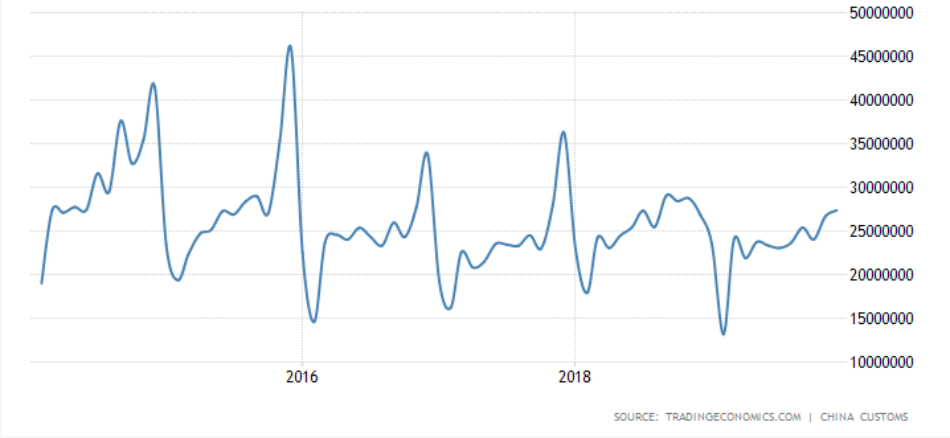
Source Credit: China Customs
Fig 7: China’s exports to Hong Kong
In the past five year, generally speaking, the net exports to Hong Kong is decreasing. Actually Hong Kong still plays a critical role for China to export goods to foreign
Wan Chan, Debby Sze, and Ngai Pun. "Economic power of the political powerless in the 2019 Hong Kong pro-democracy movement." Critical Asian Studies (2020): 1-11.
China Customs. China’s exports to Hong Kong. Tradingeconomics. 2020. [Online]: https://tradingeconomics.com/china/exports-to-hong-kong
markets because the city is under the so-called “one country, two systems” political policy. Even though Hong Kong is part of China, it practices a political and legal system that is very much similar to other major Western countries. Therefore, China’s exports rely on Hong kong as a regional distribution hub and a financial center for attracting foreign direct investment. The exports to Hongkong is dropping because U.S is imposing heavy tariffs on China’s goods.
2.3 Trade Between China and Japan
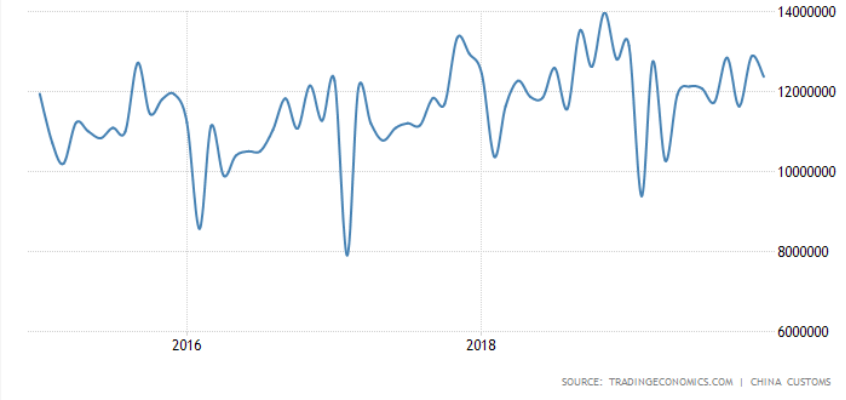
China’s imports from Japan is increasing significantly in the past five years. It increases to USD$16.3 billion in Dec 2019 as compared with USD$15.3 billion last month. It is predictable that the imports from Japan will increase as China is now imposing tariffs on the U.S imports as part of the retaliatory actions to its trading partners. In order to reduce the economic burden resulted from the trade war, China is now seeking regional economic cooperation and integration. Thus, it aims to promote the trade relationship with neighboring countries such as Japan, South Korea or ASEAN countries. For instance, 16 countries in the Asian-Pacific region are discussing on the possibility of establishing a trade deal, namely the RCEP.
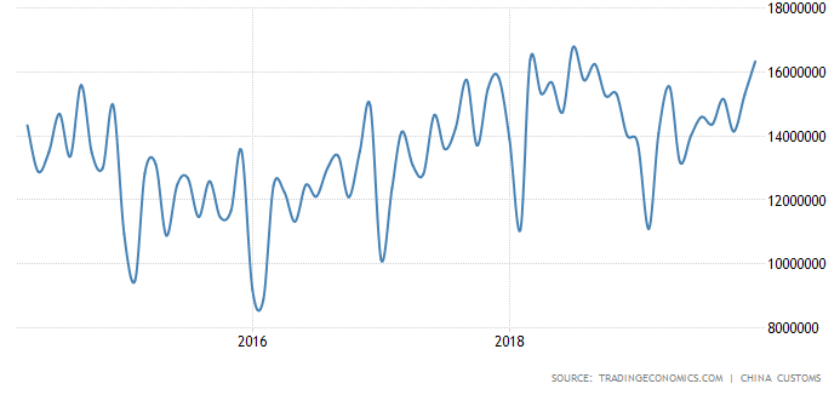
Source Credit: China Customs
Fig 8: China’s imports from Japan
China Customs. China’s imports from Japan. Tradingeconomics. 2020. [Online]: https://tradingeconomics.com/china/imports-from-Japan
Source Credit: China Customs
Fig 9: China’s exports to Japan
China’s exports to Japan are slightly increasing. Like the aforementioned, the trade relationship between China and Japan is improving due to the ongoing trade war. However, it does not change too much largely because many industries of Japan and China are overlapping. In the automotive industry, for instance, Japan can also produce its high-quality vehicles. It will thus not import such products from China.
3.0 FTA and Gravity model in explaining China’s international Trade
3.1 China’s Current FTA Status
The China’s central government deems Free Trade Agreement (FTAs) as a new platform to further opening up to the outside and accelerating its domestic economic reforms. In economics, FTA is an effective approach to integrate into global economy and strengthen economic cooperation with other countries. China is planning to discuss and sign 14 FTAs with 31 economics in the world. In fact, 8 FTAs have been signed successfully. China’s FTA can be divided into four parts, including China’s Free Trade Agreements, China’s Free Trade Agreements under negotiation, China’s Free Trade Agreement under consideration and China’s Preferential Trade agreement. The RCEP is one example of China’s Preferential Trade Agreement. The first round of discussion in regards to the Regional Comprehensive Economic Partnership (RCEP) was started in 2012. All the 16 participating countries are from the Asian-Pacific region. It includes 10 ASEAN countries. The six remaining countries are Australia, China, India, South Korea, Japan and New Zealand. RCEP, often referred as a “trade pack”, accounts for 25% of the global GDP, 30% of the global trade and 26% of foreign direct investment (FDI) flows. The major function of RCEP is to deal with
China Customs. China’s exports to Japan. Tradingeconomics. 2020. [Online]: https://tradingeconomics.com/china/exports-to-Japan
Mueller, Lukas Maximilian. "ASEAN centrality under threat–the cases of RCEP and connectivity." Journal of Contemporary East Asia Studies 8.2 (2019): 177-198.
Lu, Sheng. "Regional Comprehensive Economic Partnership (RCEP): Impact on the Integration of Textile and Apparel Supply Chain in the Asia-Pacific Region." Fashion Supply Chain Management in
issues regarding trade in goods, trade in services, investment, economic and technical corporation, intellectual property, dispute settlement, competition, etc.
3.2 Tariff and Gravity Model
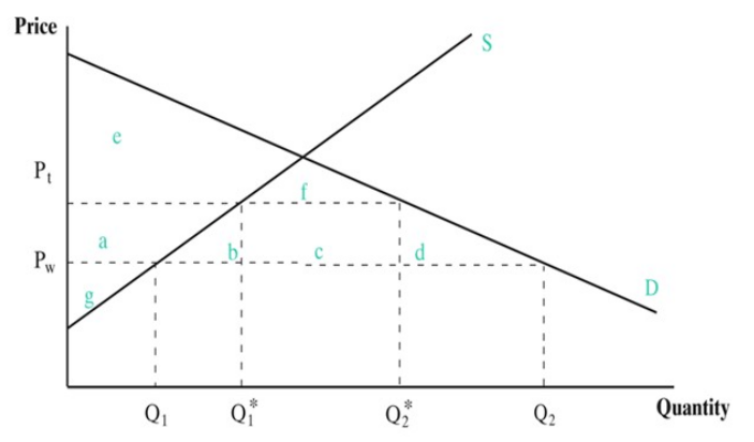
However, China is currently facing very severe problem due to the ongoing trade war with the United states. Both China and the U.S are imposing very heavy tariffs on each other. By definition, a tariff is a tax which is levied on products and services which are traded between countries. Import tariff is a tax imposed on imported goods. As shown in fig 10, originally there is only one specific price for an imported goods determined by a simple demand and supply mechanism. China’s producers are willing to sell products at Pw. It is because products in China are cheaply produced. However, when the U.S government imposes a tariff of t, the U.S importers may still import Chinese goods but at a much higher price of Pw + t, denoted as Pt. Pt is the after-tax price. The consumers’ demand will drop significantly from Q2 to Q2*. In other words, the imposition of import tariff will drive up the price of the imported goods from China and reduce the domestic consumption in the U.S. Government and local producer will benefit from such measures but U.S consumers surplus will be worsened off.
Source Credit: Author’s own source
Fig 10: The effect of a tariff
Gravity Model is a very useful model in analyzing or predicting trade patterns of a country. Tinbergen was among the first to discover that the trade between two countries actually follow the physical principles of Newton’s Universal Law of Gravity. Therefore, the Gravity model in economics is inspired from a physics theory. The model is used to assess each determinants of bilateral trade empirically.
Asia: Concepts, Models, and Cases. Springer, Singapore, 2019. 21-41.
Lewer, Joshua J., and Hendrik Van den Berg. "A gravity model of immigration." Economics letters
Generally speaking, the bilateral trade is positively affected by the size of the economies, usually measured in GDP, of two countries and negatively proportionate to the distance between the two countries. As shown in the formula below,
Tij = A (GDPi *GDPj) / Dij (1)
Tij denotes the trade flow between two countries. A is a constant of proportionality. Dij is the distance between two countries. Through taking natural logarithm, the formula can be standardized to:
In (Tij ) = a0 + a1*ln(GDPi *GDPj) - a2 * ln(Dij) (2)
However, gradually researchers realize that there are more determinants which may significantly affect the bilateral trade flow apart from the size of GDP and distance between two countries. The bilateral trade flow is also affected by cultural affinity, geography, multinational corporations, borders, FTAs, etc.
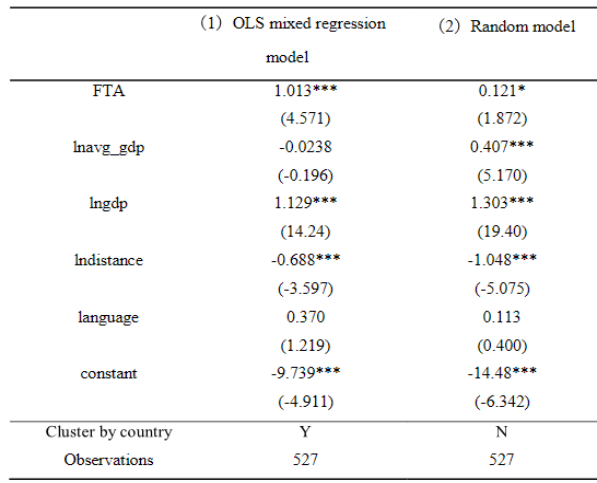
Liu (2018) has conducted a research to observe trade patterns of China with its FTA countries through both OLS mixed regression and random model based on the Gravity model. The results is illustrated in table 1 below,
Table 1: Results of the Gravity Model
Source Credit: Liu, 2018
According to the table, the regression coefficient of FTA is 1.013 (≧1). It implies that FTA will promote the trade between China and its FTA partners. Therefore, when China and the U.S are declaring trade war against each other, China’s central government is very keen in promoting the RCEP negotiations and the East Asian economic integration, a form of FTAs signed among Japan, China and South Korea.
Liu, Minyu. An Analysis of Chinese Trade and FTA using Gravity Model.2018. State University of New York College at Buffalo.
Moreover, the regression coefficient of GDP is 1.129 (≧1). It shows that GDP also has a promotional effect on the trade between China and FTA partners. The larger the size of GDP, the faster the trade flow between China and its trade partners will increase. 1.129 also means that for every 10% increase in China’s GDP, the volume of China’s exports will increase up to 11.29%. Among all China’s trading partners, the U.S has the largest GDP. Therefore, it is also expected that the U.S is China’s largest trade partner with US$479.7 billion in terms of export sales.
Last, the distance, as the aforementioned, has a negative effect on the volume of China’s exports. The regression coefficient of the geographical distance is about - 0.688. It implies that a shorter distance between two countries will effectively reduce the trade costs. Hongkong and Japan are geographically very close to China. Therefore, it is also the major reason why Hongkong and Japan are ranked the 2nd and 3rd important trade partners of China.
4.0 Conclusion
In conclusion, the U.S, Hongkong and Japan are still China’s largest trading partners. Due to the trade-war between China and the U.S, it seems that the imports from the U.S, especially agricultural products, will drop very significantly due to China’s retaliatory tariff increase. Hong Kong, originally, an ideal place for mainland China’s exported goods, to be traded with foreign countries. However, due to the recent political turmoils, it is expected that China’s exporters may be reluctant to export goods there. In addition, When the U.S is trying to reduce economic reliance on Chinese exported goods and the trade deficit between the U.S and China through imposing tariffs, it is also expected that China will look for establishing FTAs with neighboring countries such as Japan. China is also one of the firmest supporters in the RCEP negotiations. From the gravity model, it can be understood that the U.S will still be China’s most important and largest trading partner. It is largely because the GDP of the U.S is now the largest in the world. Besides, China’s GDP is also currently the second largest. The trade volume between China and the U.S will still grow very fast in the near future. Especially of recent, China and the U.S is signing a “Phase One” deal to temporarily ease the tension between both parties in the trade war. China is promised to purchase a total $200 billion U.S exports in the next four year. President Trump is currently encouraging the U.S farmers or farm workers to invest more on purchasing seeds, machines and other production tools as the demand from China in terms of agricultural goods will increase very fast. When it comes to the trade relationship between Hongkong and mainland China, it seems that the bilateral trade flow will continue to decrease. As the aforementioned, Hongkong’s GDP is very insignificant as compared with China. It is feasible for China to import or export goods from Macau, another Special Administrative Region of China.
Reference
China Customs. China Imports from United States. Tradingeconomics. 2020. [Online]: https://tradingeconomics.com/china/imports-from-united-states
China Customs. China exports to the United States. Tradingeconomics. 2020. [Online]: https://tradingeconomics.com/china/exports/united-states
China Customs. China’s Balance of Trade. Tradingeconomics. 2020. [Online]: https://tradingeconomics.com/china/balance-of-trade
China Customs. China’s imports from Hong kong. Tradingeconomics. 2020 [Online]: https://tradingeconomics.com/china/imports-from-hong-kong
China Customs. China’s exports to Hong Kong. Tradingeconomics. 2020. [Online]: https://tradingeconomics.com/china/exports-to-hong-kong
China Customs. China’s imports from Japan. Tradingeconomics. 2020. [Online]: https://tradingeconomics.com/china/imports-from-Japan
China Customs. China’s exports to Japan. Tradingeconomics. 2020. [Online]: https://tradingeconomics.com/china/exports-to-Japan
Fukunaga, Y., & Isono, I. (2013). Taking ASEAN+ 1 FTAs towards the RCEP: A mapping study. ERIA Discussion Paper Series, 2, 1-37.
Ko, Jong-hwan, and Jong Wook Ha. "A Trade War between China and the United States and Its Likely Economic Impacts." Journal of Global and Area Studies (JGA) 2.2 (2018): 47-64.
Mueller, Lukas Maximilian. "ASEAN centrality under threat–the cases of RCEP and connectivity." Journal of Contemporary East Asia Studies 8.2 (2019): 177-198.
National Bureau of Statistics of China. China GDP Annual Growth Rate. Tradingeconomics. 2019. [Online]: https://tradingeconomics.com/china/gdp-growth-annual (Accessed On 18/01/2019)
Lu, Sheng. "Regional Comprehensive Economic Partnership (RCEP): Impact on the Integration of Textile and Apparel Supply Chain in the Asia-Pacific Region." Fashion Supply Chain Management in Asia: Concepts, Models, and Cases. Springer, Singapore, 2019. 21-41.
Liu, Minyu. An Analysis of Chinese Trade and FTA using Gravity Model.2018. State University of New York College at Buffalo.
Lewer, Joshua J., and Hendrik Van den Berg. "A gravity model of immigration." Economics letters
Rahman, M. M., & Ara, L. A. (2015). TPP, TTIP and RCEP: implications for South Asian economies. South Asia Economic Journal, 16(1), 27-45.
Workman, Daniel. China’s Top Trading Partners. World’s Top Exports. 2020. [Online]: http://www.worldstopexports.com/chinas-top-import-partners/
Wan Chan, Debby Sze, and Ngai Pun. "Economic power of the political powerless in the 2019 Hong Kong pro-democracy movement." Critical Asian Studies (2020): 1-11.